This is a follow-up from my first post where I recount the circumstances that got me into scripting languages. I’ve already pleaded the case for embracing data analysis tools in that first post, so I won’t get into that again. Here, I’ll lay out nine steps for an exercise demonstrating specifically how the tools can be practical. For the exercise, you’ll use two scripting languages, structured query language (SQL) and Google Apps Script, to build reports. You’ll need a Google account for this, but a free, non-enterprise Google account is fine.
Thinking ahead
As you move through the exercise, look at how your script project handles your report data, and think about other tasks at work or in life that you wish some mechanism could handle for you. Would you be willing to learn scripting languages to get those tasks done? While you use the scripts in this exercise, will you imagine ways to make them better? Will you get ideas for other tasks you’d like the scripts to handle?
Try to notate your thoughts and retain those notes for use in the pseudocode of a possible future project. Pseudocode is just the human-language, step-by-step description of how you want a scripting or coding project to work. Writing pseudocode before you write actual code helps you to maintain a bird’s-eye perspective of your project and remind you what your project needs to accomplish in the end. It’s especially helpful if your code sprawls and becomes complex.
Scenario
For this exercise, you’ll create brokerage reports for PLAIN Realty, a real estate brokerage with offices in three cities. The reports will show
- data for individual real estate agent performance,
- data for revenue, and
- data for revenue sharing among the brokerage and its agents.
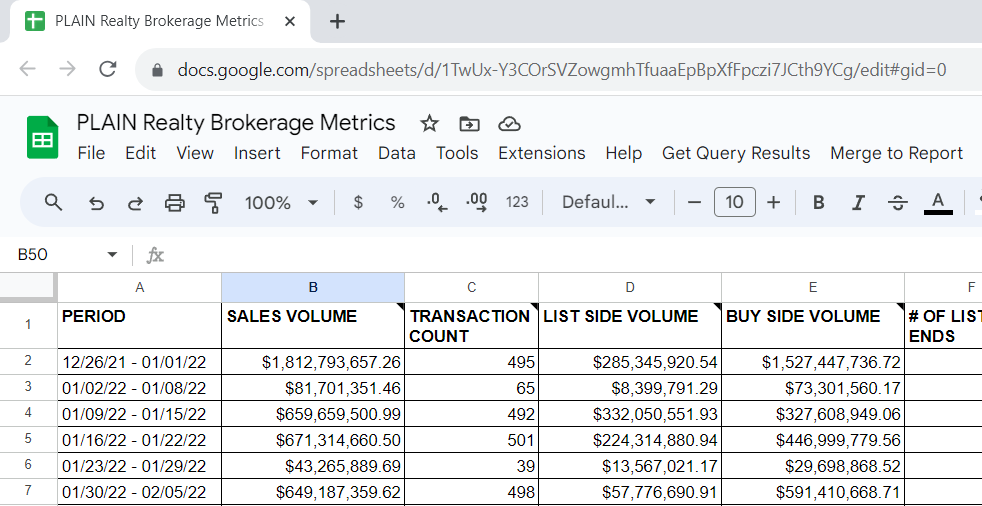
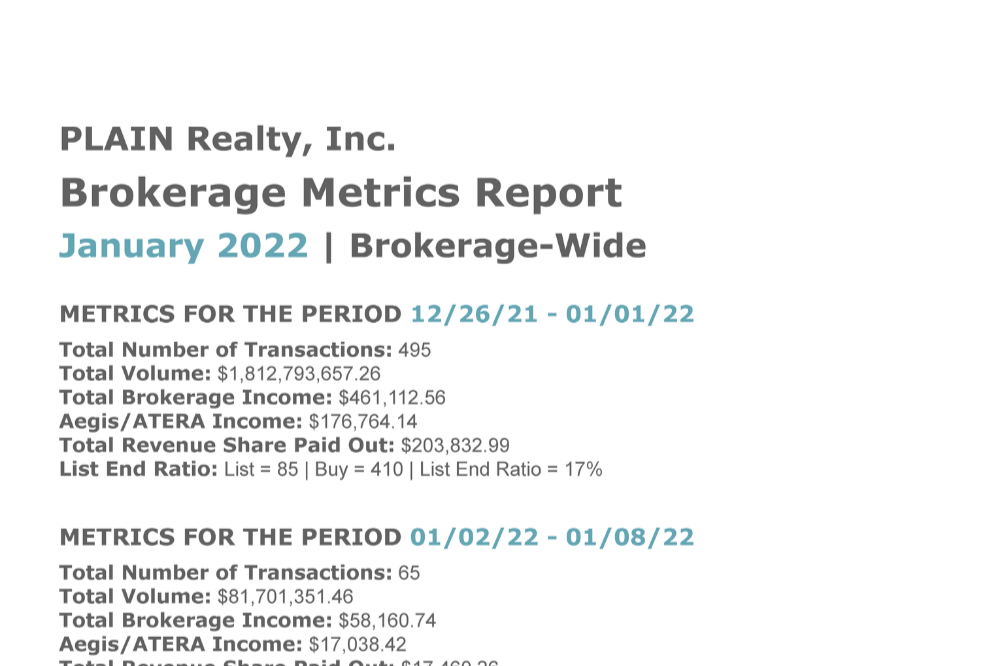
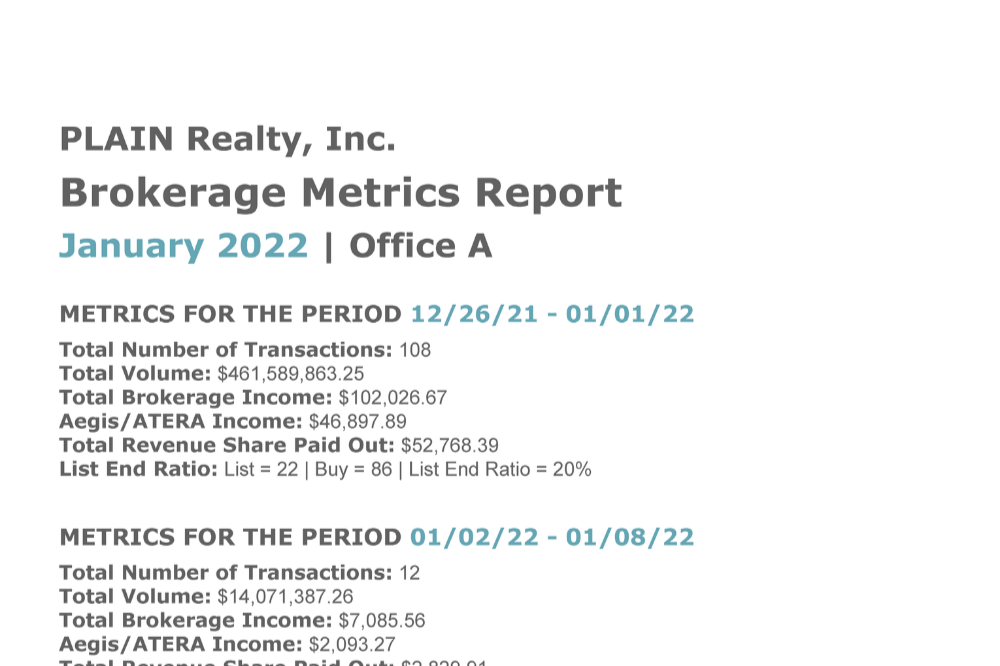
You’ll aggregate figures by week and by month. You can choose to create a set of reports for each office or a set of reports for the brokerage as a whole. Complete part of a spreadsheet report like this one and generate text to be used for readable reports like these.
Templates and data files
In your Google Drive, make your own copies of the following template files:
Brokerage Metrics Report (spreadsheet)
This is the spreadsheet report where you’ll enter agent performance data and revenue data.
This Google Doc contains the text you’ll use to create readable reports.
Also make your own copies of these data files:
The data files have been pulled from PLAIN Realty’s commission management software. Files with names beginning with perf_ contain agent performance data. Each agent performance file from the software contains data that can be sorted by office but not by date. Each file represents snapshot data for a specific period of time.
Files with names beginning with deductions_ contain data about money deducted from real estate agent commissions. Certain deductions are revenue for the brokerage, so tracking deductions is a way to track revenue.
Conversely to agent performance files, each deductions file contains data that can be sorted by date but not by office. That’s just the way the commission management software outputs data. You’ll have to deal with it! Fortunately, your scripts can deal with this for you by transforming data and making attributes comparable across all data.
Run a query – Step 1 (accessing the Google Cloud console)
Structured query language, or SQL for short, belongs to a category of coding languages called scripting languages. Computer programmers distinguish script from other code, noting that script is used to interact with or manipulate an existing computer program. Other coding languages can be used to write programs from scratch. SQL is a scripting language that is primarily used to access databases and manipulate data. You’ll use SQL to write a query, a set of instructions for retrieving data.
Start by navigating to the BigQuery page of the Google Cloud console (https://console.cloud.google.com/bigquery). BigQuery is Google’s query environment.
If you’re accessing the Google Cloud console for the first time, follow the setup prompts that appear, including prompts to set your country and agree to the terms of service. For this exercise, use the sandbox version of BigQuery, which comes with no cost and no need to provide billing information. Dismiss any prompt asking you to upgrade to the billable version of BigQuery.
Run a Query – Step 2 (creating a project)
You need a Google Cloud project before you can use BigQuery. Next to the Google Cloud logo in the top-left corner of the page, click on the project selector to create a project.

If you’ve automatically been provided with a project named “My First Project,” try creating a different project and giving it the name/ID of your choice. If you see no existing project, create one now. Unless you run a business or some type of organization that you want to associate with this project, you can let the project location be No organization. Once you create it, select your new project with the name you chose and use that moving forward.
Run a Query – Step 3 (creating a dataset)
Look for your newly-created project in the Explorer pane of the BigQuery page.
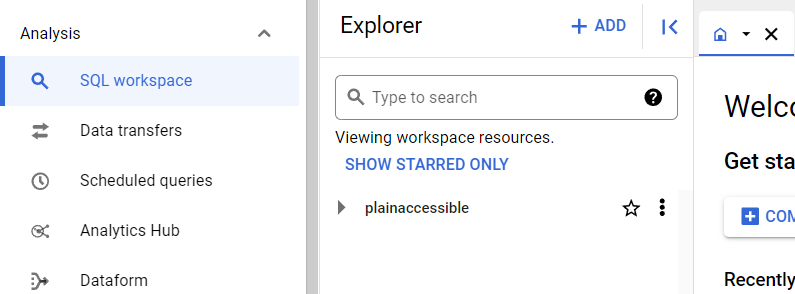
Click the ellipsis (⋮) at the end of the project ID to create a new dataset.

Name the dataset “BrokeragePerformance,” or you can choose a different name. Set the location type of your choice. You can ignore any other fields that aren’t required and click CREATE DATASET.
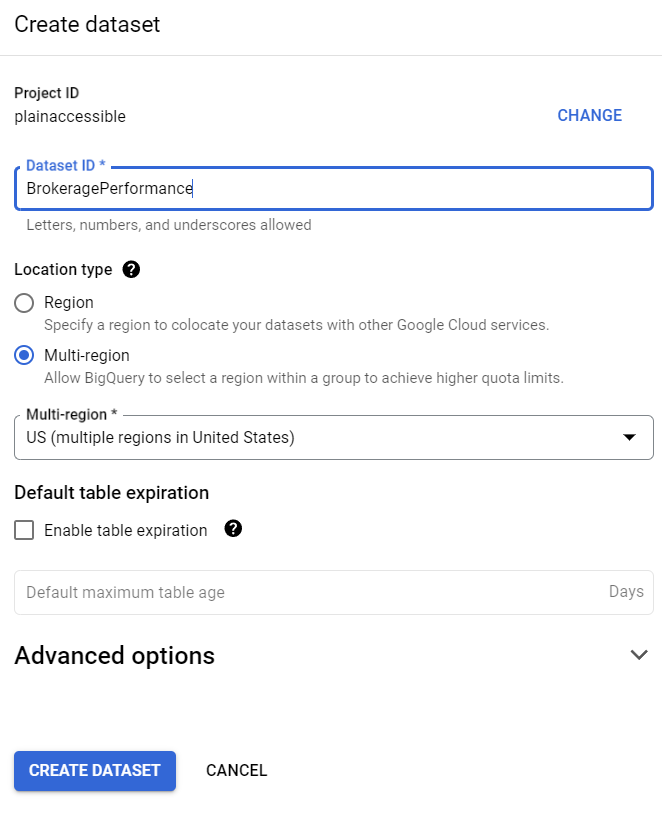
After it’s created, your new dataset should appear. Click the caret (🞂, 🞃) to the right of the project ID to toggle the visibility of your dataset.
Run a query – Step 4 (adding data tables)
Click the ellipsis at the end of the dataset’s name to add data tables to your BigQuery project. Your query will retrieve data from these tables. Try creating the table for agent performance for the week of 12/16/2021 – 1/1/2022 first. Let a Google Drive file be the source file for your table by selecting the Drive option for Create table from.
To get the Drive URI, open your copy of the Google Sheet containing the data. The URI is the URL of your Google Sheet page. For this exercise, when you enter the URI, you can include the URL parameter at the end of the URL (/edit#…) or leave it out.

The file format is Google Sheet. In the Table field, name your table “perf_2021_12_26_2022_01_01.” You’ll use the same naming convention (perf_yyyy_mm_dd_yyyy_mm_dd) for all of your agent performance tables. That name format is needed for this specific exercise. Let the table be an external table, and let BigQuery auto-detect the schema. For this exercise, you can ignore any other fields that aren’t required.
Click CREATE TABLE to create your data table. Repeat Step 4 for the rest of the agent performance data tables.
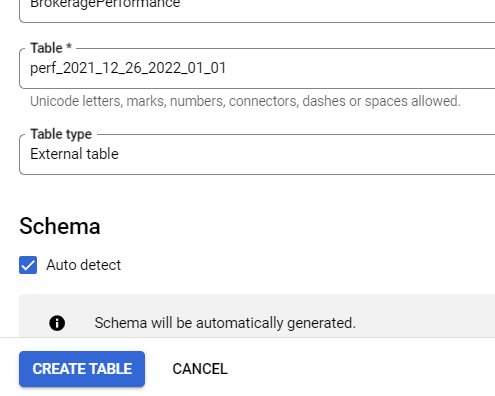
For the deductions tables, use deductions_[office name] for the naming convention (e.g., deductions_A, deductions_B, deductions_C). Also adjust one additional setting before creating tables: click the chevron (⌵) at the end of Advanced options to see the Header rows to skip option. Enter 1 to skip one row. This row is a header row within the deductions tables.
Run a query – Step 5 (writing the query)
Click on any one of your tables to examine the table’s properties in the large details pane to the right of the page. Run a simple query to retrieve your table’s data and to get accustomed to the BigQuery environment. While a table is selected, hit the QUERY button at the top of the pane next to the table’s name.
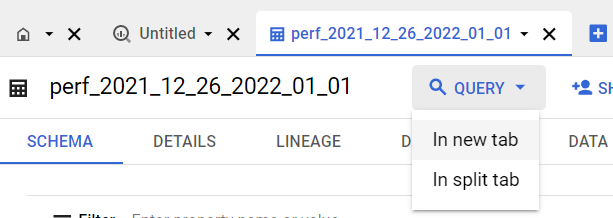
In the query editor, enter a statement in the following format to write your first query:
SELECT * FROM `[your project ID].[your dataset name].[your table name]`Using an asterisk (*) after SELECT returns all columns of your data table. In cases where you’re processing a lot of data, or when you’re not sure how large your data table is, you should avoid using SELECT *. Accidentally processing too much data for a query can make the query run more slowly than it needs to. In the case of a BigQuery plan with billing, heavy processing can incur a huge cost too. Your data tables for this exercise are small, so SELECT * is fine here. Hit the RUN button and view the query results.
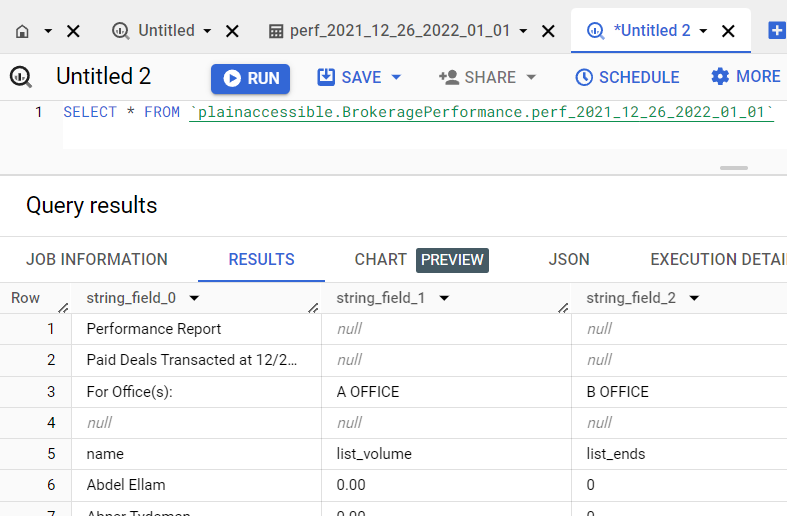
After writing your first test query, click the plus sign at the top of the pane to open a new tab. Paste the following script into the query editor:
--Read the comments to get a general sense of what's happening and to see any instructions. Then hit the "▶ RUN" button. Take apart each section of the script and examine in your free time.

---------------------These variables set the date range for your query.
DECLARE year_start STRING DEFAULT '2022';
DECLARE mo_start STRING DEFAULT '01';
DECLARE day_start STRING DEFAULT '01';
DECLARE year_end STRING DEFAULT '2022';
DECLARE mo_end STRING DEFAULT '01';
DECLARE day_end STRING DEFAULT '31';

---------------------These variables create date strings and format the strings in the DATE data type.
DECLARE begindate DATE DEFAULT PARSE_DATE('%Y-%m-%d',CONCAT('',year_start,'-',mo_start,'-',day_start));
DECLARE begindate_format STRING DEFAULT FORMAT_DATE('%m/%d/%Y', begindate);
DECLARE enddate DATE DEFAULT PARSE_DATE('%Y-%m-%d',CONCAT('',year_end,'-',mo_end,'-',day_end));
DECLARE enddate_format STRING DEFAULT FORMAT_DATE('%m/%d/%Y', enddate);

---------------------These arrays will hold your agent performance data in the right formats.
DECLARE perf_source ARRAY<STRUCT<name STRING, list_volume FLOAT64, list_ends FLOAT64, sell_volume FLOAT64, sell_ends FLOAT64, gross_commission FLOAT64, deduction_total FLOAT64, net_pay FLOAT64, other_income FLOAT64, office STRING, active_during STRING>>;

DECLARE perf_p_source ARRAY<STRUCT<string_field_0 STRING, string_field_1 STRING, string_field_2 STRING, string_field_3 STRING, string_field_4 STRING, string_field_5 STRING, string_field_6 STRING, string_field_7 STRING, string_field_8 STRING, string_field_9 STRING, string_field_10 STRING>>;

---------------------These arrays group deductions into categories of interest: revenue share, base fees, transaction fees, and the Aegis/ATERA category.
DECLARE rev_share_group ARRAY <STRING> DEFAULT ['Rev Share A', 'Rev Share A*', 'Rev Share A**', 'Rev Share B', 'Rev Share B*', 'Rev Share B**', 'Rev Share C', 'Rev Share C*', 'Rev Share C**'];
DECLARE base_split_group ARRAY <STRING> DEFAULT ['Aegis Split', 'Piccard Split', 'Voyager Split', 'Intellicel Split', 'ATERA Split', 'Broker Transaction (100%)', 'Team Cap'];
DECLARE transaction_fee_group ARRAY <STRING> DEFAULT ['Transaction Fee'];
DECLARE aegis_atera_group ARRAY <STRING> DEFAULT ['Aegis Split', 'ATERA Split'];

---------------------These statements take your agent performance data from your Google Sheets and place the data into arrays of data with the right data formats. Do this for each EXECUTE IMMEDIATE statement: Look for "FROM `plainaccessible.BrokeragePerformance.perf_" and change: "plainaccessible" to your Google Cloud project name, "BrokeragePerformance" to your dataset name (if different).
EXECUTE IMMEDIATE CONCAT('SELECT ARRAY_AGG(STRUCT(string_field_0 AS name, CAST (string_field_1 AS FLOAT64) AS list_volume, CAST (string_field_2 AS FLOAT64) AS list_ends, CAST (string_field_3 AS FLOAT64) AS sell_volume, CAST (string_field_4 AS FLOAT64) AS sell_ends, CAST (string_field_5 AS FLOAT64) AS gross_commission, CAST (string_field_6 AS FLOAT64) AS deduction_total, CAST (string_field_7 AS FLOAT64) AS net_pay, CAST (string_field_8 AS FLOAT64) AS other_income, string_field_9 AS office, string_field_10 AS active_during)) FROM `plainaccessible.BrokeragePerformance.perf_', year_start, '_', mo_start, '_', day_start, '_', year_end, '_', mo_end, '_', day_end, '` WHERE NOT (REGEXP_CONTAINS (string_field_0, \"^Performance Report\") OR REGEXP_CONTAINS (string_field_0, \"^Paid Deals Transacted at\") OR REGEXP_CONTAINS (string_field_0, \"^For Office.*\") OR REGEXP_CONTAINS (string_field_0, \"^name\")  OR REGEXP_CONTAINS (string_field_0, \"^Total\")) ') INTO perf_source;

EXECUTE IMMEDIATE CONCAT('SELECT ARRAY_AGG(STRUCT(string_field_0, string_field_1, string_field_2, string_field_3, string_field_4, string_field_5, string_field_6, string_field_7, string_field_8, string_field_9, string_field_10)) FROM `plainaccessible.BrokeragePerformance.perf_', year_start, '_', mo_start, '_', day_start, '_', year_end, '_', mo_end, '_', day_end, '`') INTO perf_p_source;

---------------------The lengthy remainder of this query is a combination of 1) common table expressions that perform the necessary agrregations on agent performance data and on deduction data and 2) a final statement to bring everything together.
WITH
perf_p AS (---------------------This part creates a string that identifies the period (week or month).
  SELECT
    REGEXP_EXTRACT(string_field_0, '.*Transacted at (.*)') AS period,
    CONCAT( FORMAT_DATE('%m/%d/%y', DATE (PARSE_DATE ('%m/%d/%Y', REGEXP_EXTRACT(string_field_0, '.*Transacted at (.*) up to.*')))), ' - ', FORMAT_DATE('%m/%d/%y', DATE (PARSE_DATE ('%m/%d/%Y', REGEXP_EXTRACT(string_field_0, '.*up to(.*)')))) ) AS period_mod,
    PARSE_DATE('%m/%d/%Y', REGEXP_EXTRACT(string_field_0,'.*Transacted at (.*) up to')) AS period_start,
    PARSE_DATE('%m/%d/%Y', REGEXP_EXTRACT(string_field_0,'.*up to (.*)')) AS period_end
  FROM UNNEST(perf_p_source)
  WHERE REGEXP_CONTAINS(string_field_0, '^Paid Deals Transacted at')
  LIMIT 2
),
perf_metrics AS (---------------------This part determines agent performance metrics for each office.
  SELECT
    office,
    (SUM(sell_volume) OVER (PARTITION BY office)) + (SUM(list_volume) OVER (PARTITION BY office)) AS total_volume,
    SUM(sell_volume) OVER (PARTITION BY office) AS sell_volume,
    SUM(list_volume) OVER (PARTITION BY office) AS list_volume,
    (SUM(sell_ends) OVER (PARTITION BY office)) + (SUM(list_ends) OVER (PARTITION BY office)) AS total_ends,
    SUM(list_ends) OVER (PARTITION BY office) AS list_ends,
    SUM(sell_ends) OVER (PARTITION BY office) AS sell_ends,
    (SUM(list_ends) OVER (PARTITION BY office)) / ((SUM(sell_ends) OVER (PARTITION BY office)) + (SUM(list_ends) OVER (PARTITION BY office))) AS list_ratio,
    ((SUM(sell_volume) OVER (PARTITION BY office)) + (SUM(list_volume) OVER (PARTITION BY office))) / ((SUM(sell_ends) OVER (PARTITION BY office)) + (SUM(list_ends) OVER (PARTITION BY office))) AS avg_price,
    (SUM(sell_volume) OVER (PARTITION BY office)) / (SUM(sell_ends) OVER (PARTITION BY office)) AS avg_sell_price,
    (SUM(list_volume) OVER (PARTITION BY office)) / (SUM(list_ends) OVER (PARTITION BY office)) AS avg_list_price
  FROM UNNEST(perf_source)
),
perf_metrics_all AS (---------------------This part determines agent performance metrics for the whole brokerage (similar to above but without grouping or partitioning).
  SELECT
    'ALL' as office,
    (SUM(sell_volume)) + (SUM(list_volume)) AS total_volume,
    SUM(sell_volume) AS sell_volume,
    SUM(list_volume) AS list_volume,
    (SUM(sell_ends)) + (SUM(list_ends)) AS total_ends,
    SUM(list_ends) AS list_ends,
    SUM(sell_ends) AS sell_ends,
    SUM(list_ends) / (SUM(sell_ends) + SUM(list_ends)) AS list_ratio,
    (SUM(sell_volume) + SUM(list_volume)) / (SUM(sell_ends) + SUM(list_ends)) AS avg_price,
    SUM(sell_volume) / SUM(sell_ends) AS avg_sell_price,
    SUM(list_volume) / SUM(list_ends) AS avg_list_price
  FROM UNNEST(perf_source)),
perf_all AS (---------------------Offices + whole brokerage
SELECT ---------------------This part gets metrics for offices.
  perf_p.period,
  perf_p.period_mod,
  perf_p.period_start,
  perf_p.period_end,
  perf_metrics.*
FROM perf_p, perf_metrics
UNION DISTINCT
SELECT ---------------------This part adds combined metrics for the whole brokerage.
  perf_p.period,
  perf_p.period_mod,
  perf_p.period_start,
  perf_p.period_end,
  perf_metrics_all.*
FROM perf_p, perf_metrics_all),
deduct_a_office AS (---------------------This part determines the deduction metrics for Office A.
  SELECT
    'A OFFICE' AS office,
    CASE
      WHEN (date >= begindate AND date <= enddate) THEN CONCAT(begindate_format, ' up to ', enddate_format)
      ELSE 'not in range'
    END AS period,
    deduction,
    total
  FROM `plainaccessible.BrokeragePerformance.deductions_A`----------------------Do this: Change: "plainaccessible" to your project name, "BrokeragePerformance" to your dataset name (if different).
  WHERE (date >= begindate AND date <= enddate)
),
deduct_b_office AS (---------------------This part determines the deduction metrics for Office B.
  SELECT
    'B OFFICE' AS office,
    CASE
      WHEN (date >= begindate AND date <= enddate) THEN CONCAT(begindate_format, ' up to ', enddate_format)
      ELSE 'not in range'
    END AS period,
    deduction,
    total
  FROM `plainaccessible.BrokeragePerformance.deductions_B`----------------------Do this: Change: "plainaccessible" to your project name, "BrokeragePerformance" to your dataset name (if different).
  WHERE (date >= begindate AND date <= enddate)
),
deduct_c_office AS (---------------------This part determines the deduction metrics for Office C.
  SELECT
    'C OFFICE' AS office,
    CASE
      WHEN (date >= begindate AND date <= enddate) THEN CONCAT(begindate_format, ' up to ', enddate_format)
      ELSE 'not in range'
    END AS period,
    deduction,
    total
  FROM `plainaccessible.BrokeragePerformance.deductions_C`----------------------Do this: Change: "plainaccessible" to your project name, "BrokeragePerformance" to your dataset name (if different).
  WHERE (date >= begindate AND date <= enddate)
),
deduct_each_office AS (---------------------This part combines deductions for offices A, B, and C in one table.
  SELECT * FROM deduct_a_office
  UNION ALL
  SELECT * FROM deduct_b_office
  UNION ALL
  SELECT * FROM deduct_c_office
),
deduct_all AS (---------------------Offices + whole brokerage
  SELECT---------------------This part gets deduction metrics (deductions in categories!) for each office.
  office,
  period,
  SUM(IF(deduction IN UNNEST(rev_share_group), total, 0)) AS rev_share,
  SUM(IF(deduction IN UNNEST(base_split_group), total, 0)) AS base_split,
  SUM(IF(deduction IN UNNEST(transaction_fee_group), total, 0)) AS transaction_fee,
  SUM(IF(deduction IN UNNEST(aegis_atera_group), total, 0)) AS aa_split,
  (SUM(IF(deduction IN UNNEST(base_split_group), total, 0)) + SUM(IF(deduction IN UNNEST(transaction_fee_group), total, 0))) AS total_brokerage_income
FROM deduct_each_office
GROUP BY
  office,
  period
UNION ALL
SELECT---------------------This part adds combined metrics for the whole brokerage (similar to above but without grouping by office).
  'ALL' AS office,
  period,
  SUM(IF(deduction IN UNNEST(rev_share_group), total, 0)) AS rev_share,
  SUM(IF(deduction IN UNNEST(base_split_group), total, 0)) AS base_split,
  SUM(IF(deduction IN UNNEST(transaction_fee_group), total, 0)) AS transaction_fee,
  SUM(IF(deduction IN UNNEST(aegis_atera_group), total, 0)) AS aa_split,
  (SUM(IF(deduction IN UNNEST(base_split_group), total, 0)) + SUM(IF(deduction IN UNNEST(transaction_fee_group), total, 0))) AS total_brokerage_income
FROM deduct_each_office
GROUP BY period
)---------------------The last part of the statement (below) brings everything together.
SELECT perf_all.*, deduct_all.rev_share, deduct_all.base_split, deduct_all.transaction_fee, deduct_all.aa_split, deduct_all.total_brokerage_income
FROM perf_all
JOIN deduct_all
ON perf_all.period = deduct_all.period AND perf_all.office = deduct_all.office
ORDER BY CASE
  WHEN office = 'ALL' THEN 1
  WHEN office = 'A OFFICE' THEN 2
  WHEN office = 'B OFFICE' THEN 3
  WHEN office = 'C OFFICE' THEN 4
  ELSE 5 END ASC;
--Change the variables for the date range at the top. Then run the query again. The date range has to be one of the exact calendar weeks or the exact calendar month for which you have agent performance data.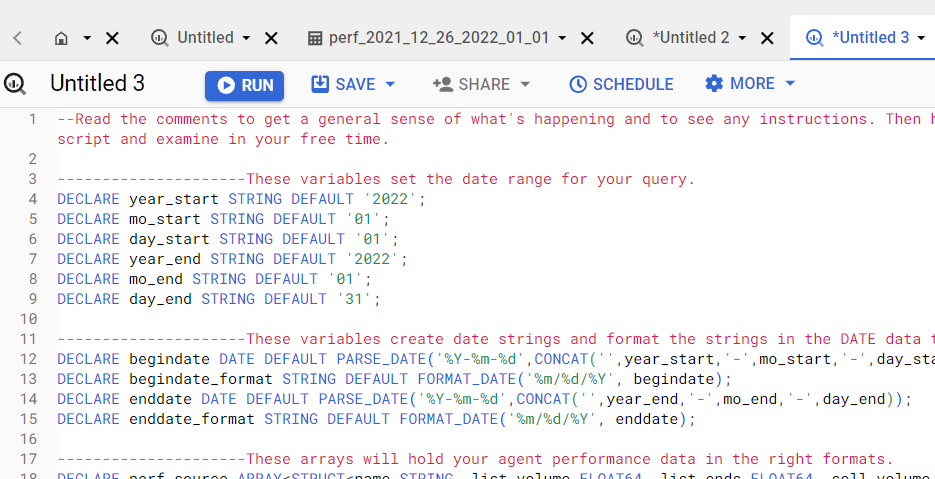
Comments that don’t affect the behavior of the query are preceded by two hyphens (--). Be sure to read and follow the directions in the comments, because edits are required in a few places throughout the script before you can run it. Wherever the query references plainaccessible, be sure to change that to your own project ID. If your dataset name is something other than BrokeragePerformance, be sure to change that too. Once your query is ready, run it to see what you get.

The first two results are the outputs of SQL statements that need to execute before the final statement can execute. The final statement outputs the aggregated data that you’ll use in your report.
Change the date range variables at the beginning of the script to get query results for different date ranges. Note that you only have data for the first six calendar weeks of 2022 and data for the month of January 2022, so you can only run queries for seven specific date ranges. Save your query when you’ve finished testing it.

Insert query results – Step 6 (accessing the Google Apps Script editor)
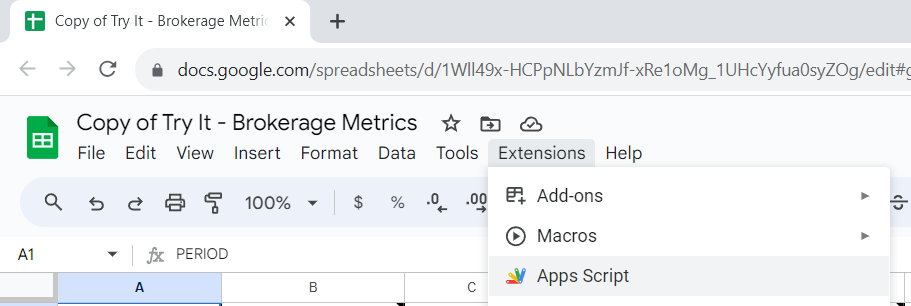
Your query results are most useful when you can insert them into reports without having to copy-and-paste them. You can make this happen with Google Apps Script, a scripting language that modifies Google Sheets, Google Docs, and the other apps in the Google suite of products. To get started with Google Apps Script, open your copy of the brokerage metrics spreadsheet. Click Extensions in the menu bar. Then click Apps Script to open the Apps Script editor.
Insert query results – Step 7 (writing the Apps Script)
Give your Apps Script project a name if you want to. Remove the placeholder text in the script editor, and paste the following script in:
/**Read the comments to get a general sense of what's happening and to see any instructions.
 * Then hit the "▶ Run" button. Comments are surrounded by forward slashes and asterisks, or
 * they follow two forward slashes (//).*/

/**Do this first:
 * 1) Click on the "+" next to "Services" in the left pane to enable an API service.
 * 2) Select "BigQuery API service".
 * 3) You can let "BigQuery" be the identifier.
 * 4) Click the "Add" button at the bottom of the window.*/


/**onOpen() is a trigger that allows you to run your functions from the Google Sheets interface.
 * The options for running your functions will appear in the menu bar of the Google Sheets interface.*/
function onOpen() {

  let ui = SpreadsheetApp.getUi();

    ui.createMenu('Get Query Results')
      .addItem('Get results','runQuery')
      .addToUi();

    ui.createMenu('Merge to Report')
      .addItem('Merge','mergeToReport')
      .addToUi();
}//End of the onOpen() trigger.

/**The runQuery() function takes results from the query you wrote with BigQuery and inserts the
 * appropriate values into one row of your Brokerage Metrics Report (spreadsheet). Run this
 * function multiple times until you have values for all weeks/months.
 * Do this: At Line #'s 92, 108, 109, 161, 168, and 175: Change the value of projectId or change the
 * project ID from "plainaccessible" to "[your Google Cloud project ID]".
 * Do this: At Line #'s 108, 109, 161, 168, and 175: Change the name of the dataset from
 * "BrokeragePerformance" to "[your BigQuery dataset name (if different)]".*/
function runQuery() {
  DriveApp.getRootFolder();

  try{
    var officeInput = inputPromptFN('Get results for (enter 1 of the 8 options below) (case-sensitive):\n\n- \"ALL WEEKLY\" or \"ALL MONTHLY\"\n- \"A OFFICE WEEKLY\" or \"A OFFICE MONTHLY\"\n- \"B OFFICE WEEKLY\" or \"B OFFICE MONTHLY\"\n- \"C OFFICE WEEKLY\" or \"C OFFICE MONTHLY\"');
    if (officeInput === null || typeof officeInput === 'undefined') {
      console.log('Operation canceled by user.');
      return;
    };

    var officeRegExp = new RegExp('^(.*)(?= [^ ]+$)');
    var setOffice = officeRegExp.exec(officeInput)[1];
    if (setOffice !== 'ALL' && setOffice !== 'A OFFICE' && setOffice !== 'B OFFICE' && setOffice !== 'C OFFICE') {
      try {
        throw new Error('Invalid office. Office needs to be \"ALL,\" \"A OFFICE,\" \"B OFFICE,\" or \"C OFFICE\" (case-sensitive).');
      } catch (error) {
        console.error(error.message);
        SpreadsheetApp.getUi().alert(error.message);
        return;
      }
    };
    var timeFrameRegExp = new RegExp('\\s(\\w+)$');
    var timeFrame = timeFrameRegExp.exec(officeInput)[0].trim();
    if (timeFrame !== 'WEEKLY' && timeFrame !== 'MONTHLY') {
      try {
        throw new Error('Invalid time frame. Time frame needs to be \"WEEKLY\" or \"MONTHLY\" (case-sensitive).');
      } catch (error) {
        console.error(error.message);
        SpreadsheetApp.getUi().alert(error.message);
        return;
      }
    };

    var moStartInput = inputPromptFN('Enter start month (MM) (e.g., 12):');
    if (moStartInput === null || typeof moStartInput === 'undefined') {
      console.log('Operation canceled by user.');
      return;};
    var dayStartInput = inputPromptFN('Enter start day (DD) (e.g., 26):');
    if (dayStartInput === null || typeof dayStartInput === 'undefined') {
      console.log('Operation canceled by user.');
      return;};
    var yearStartInput = inputPromptFN('Enter start year (YYYY) (e.g., 2021):');
    if (yearStartInput === null || typeof yearStartInput === 'undefined') {
      console.log('Operation canceled by user.');
      return;};
    var moEndInput = inputPromptFN('Enter end month (MM) (e.g., 01):');
    if (moEndInput === null || typeof moEndInput === 'undefined') {
      console.log('Operation canceled by user.');
      return;};
    var dayEndInput = inputPromptFN('Enter end day (DD) (e.g., 01):');
    if (dayEndInput === null || typeof dayEndInput === 'undefined') {
      console.log('Operation canceled by user.');
      return;};
    var yearEndInput = inputPromptFN('Enter end year (YYYY) (e.g., 2022):');
    if (yearEndInput === null || typeof yearEndInput === 'undefined') {
      console.log('Operation canceled by user.');
      return;};

    var projectId = 'plainaccessible';//Do this: Change the project ID to your own Google Cloud project ID.


    /******************************Your query from BigQuery:******************************/
    var request = {
      query:
        "DECLARE begindate DATE DEFAULT PARSE_DATE('%Y-%m-%d',CONCAT(''," + yearStartInput + ",'-'," + moStartInput + ",'-'," + dayStartInput + ")); " +
        "DECLARE begindate_format STRING DEFAULT FORMAT_DATE('%m/%d/%Y', begindate); " +
        "DECLARE enddate DATE DEFAULT PARSE_DATE('%Y-%m-%d',CONCAT(''," + yearEndInput + ",'-'," + moEndInput + ",'-'," + dayEndInput + ")); " +
        "DECLARE enddate_format STRING DEFAULT FORMAT_DATE('%m/%d/%Y', enddate); " +
        "DECLARE perf_source ARRAY<STRUCT<name STRING, list_volume FLOAT64, list_ends FLOAT64, sell_volume FLOAT64, sell_ends FLOAT64, gross_commission FLOAT64, deduction_total FLOAT64, net_pay FLOAT64, other_income FLOAT64, office STRING, active_during STRING>>; " +
        "DECLARE perf_p_source ARRAY<STRUCT<string_field_0 STRING, string_field_1 STRING, string_field_2 STRING, string_field_3 STRING, string_field_4 STRING, string_field_5 STRING, string_field_6 STRING, string_field_7 STRING, string_field_8 STRING, string_field_9 STRING, string_field_10 STRING>>; " +
        "DECLARE rev_share_group ARRAY <STRING> DEFAULT ['Rev Share A', 'Rev Share A*', 'Rev Share A**', 'Rev Share B', 'Rev Share B*', 'Rev Share B**', 'Rev Share C', 'Rev Share C*', 'Rev Share C**']; " +
        "DECLARE base_split_group ARRAY <STRING> DEFAULT ['Aegis Split', 'Piccard Split', 'Voyager Split', 'Intellicel Split', 'ATERA Split', 'Broker Transaction (100%)', 'Team Cap']; " +
        "DECLARE transaction_fee_group ARRAY <STRING> DEFAULT ['Transaction Fee']; " +
        "DECLARE aegis_atera_group ARRAY <STRING> DEFAULT ['Aegis Split', 'ATERA Split']; " +
        "EXECUTE IMMEDIATE CONCAT('SELECT ARRAY_AGG(STRUCT(string_field_0 AS name, CAST (string_field_1 AS FLOAT64) AS list_volume, CAST (string_field_2 AS FLOAT64) AS list_ends, CAST (string_field_3 AS FLOAT64) AS sell_volume, CAST (string_field_4 AS FLOAT64) AS sell_ends, CAST (string_field_5 AS FLOAT64) AS gross_commission, CAST (string_field_6 AS FLOAT64) AS deduction_total, CAST (string_field_7 AS FLOAT64) AS net_pay, CAST (string_field_8 AS FLOAT64) AS other_income, string_field_9 AS office, string_field_10 AS active_during)) FROM `plainaccessible.BrokeragePerformance.perf_', '" + yearStartInput + "', '_', '" + moStartInput + "', '_', '" + dayStartInput + "', '_', '" + yearEndInput + "', '_', '" + moEndInput + "', '_', '" + dayEndInput + "', '` WHERE NOT (REGEXP_CONTAINS (string_field_0, \"^Performance Report\") OR REGEXP_CONTAINS (string_field_0, \"^Paid Deals Transacted at\") OR REGEXP_CONTAINS (string_field_0, \"^For Office.*\") OR REGEXP_CONTAINS (string_field_0, \"^name\")  OR REGEXP_CONTAINS (string_field_0, \"^Total\")) ') INTO perf_source; " + //Do this: 1) Change the project ID to your own Google Cloud project ID. 2) Change the dataset name to your your own dataset name, if it's not "Brokerageperformance".
        "EXECUTE IMMEDIATE CONCAT('SELECT ARRAY_AGG(STRUCT(string_field_0, string_field_1, string_field_2, string_field_3, string_field_4, string_field_5, string_field_6, string_field_7, string_field_8, string_field_9, string_field_10)) FROM `plainaccessible.BrokeragePerformance.perf_', '" + yearStartInput + "', '_', '" + moStartInput + "', '_', '" + dayStartInput + "', '_', '" + yearEndInput + "', '_', '" + moEndInput + "', '_', '" + dayEndInput + "', '`') INTO perf_p_source; " + //Do this: 1) Change the project ID to your own Google Cloud project ID. 2) Change the dataset name to your your own dataset name, if it's not "Brokerageperformance".
        "WITH perf_p AS (SELECT " +
        "REGEXP_EXTRACT(string_field_0, '.*Transacted at (.*)') AS period, " +
        "CONCAT( FORMAT_DATE('%m/%d/%y', DATE (PARSE_DATE ('%m/%d/%Y', REGEXP_EXTRACT(string_field_0, '.*Transacted at (.*) up to.*')))), ' - ', FORMAT_DATE('%m/%d/%y', DATE (PARSE_DATE ('%m/%d/%Y', REGEXP_EXTRACT(string_field_0, '.*up to(.*)')))) ) AS period_mod, " +
        "PARSE_DATE('%m/%d/%Y', REGEXP_EXTRACT(string_field_0,'.*Transacted at (.*) up to')) AS period_start, " +
        "PARSE_DATE('%m/%d/%Y', REGEXP_EXTRACT(string_field_0,'.*up to (.*)')) AS period_end " +
        "FROM UNNEST(perf_p_source) WHERE REGEXP_CONTAINS(string_field_0, '^Paid Deals Transacted at') LIMIT 2), " +
        "perf_metrics AS (SELECT " +
        "office, " +
        "(SUM(sell_volume) OVER (PARTITION BY office)) + (SUM(list_volume) OVER (PARTITION BY office)) AS total_volume, " +
        "SUM(sell_volume) OVER (PARTITION BY office) AS sell_volume, " +
        "SUM(list_volume) OVER (PARTITION BY office) AS list_volume, " +
        "(SUM(sell_ends) OVER (PARTITION BY office)) + (SUM(list_ends) OVER (PARTITION BY office)) AS total_ends, " +
        "SUM(list_ends) OVER (PARTITION BY office) AS list_ends, " +
        "SUM(sell_ends) OVER (PARTITION BY office) AS sell_ends, " +
        "(SUM(list_ends) OVER (PARTITION BY office)) / ((SUM(sell_ends) OVER (PARTITION BY office)) + (SUM(list_ends) OVER (PARTITION BY office))) AS list_ratio, " +
        "((SUM(sell_volume) OVER (PARTITION BY office)) + (SUM(list_volume) OVER (PARTITION BY office))) / ((SUM(sell_ends) OVER (PARTITION BY office)) + (SUM(list_ends) OVER (PARTITION BY office))) AS avg_price, " +
        "(SUM(sell_volume) OVER (PARTITION BY office)) / (SUM(sell_ends) OVER (PARTITION BY office)) AS avg_sell_price, " +
        "(SUM(list_volume) OVER (PARTITION BY office)) / (SUM(list_ends) OVER (PARTITION BY office)) AS avg_list_price " +
        "FROM UNNEST(perf_source)), " +
        "perf_metrics_all AS ( SELECT " +
        "'ALL' as office, " +
        "(SUM(sell_volume)) + (SUM(list_volume)) AS total_volume, " +
        "SUM(sell_volume) AS sell_volume, " +
        "SUM(list_volume) AS list_volume, " +
        "(SUM(sell_ends)) + (SUM(list_ends)) AS total_ends, " +
        "SUM(list_ends) AS list_ends, " +
        "SUM(sell_ends) AS sell_ends, " +
        "SUM(list_ends) / (SUM(sell_ends) + SUM(list_ends)) AS list_ratio, " +
        "(SUM(sell_volume) + SUM(list_volume)) / (SUM(sell_ends) + SUM(list_ends)) AS avg_price, " +
        "SUM(sell_volume) / SUM(sell_ends) AS avg_sell_price, " +
        "SUM(list_volume) / SUM(list_ends) AS avg_list_price " +
        "FROM UNNEST(perf_source)), " +
        "perf_all AS (SELECT " +
        "perf_p.period, " +
        "perf_p.period_mod, " +
        "perf_p.period_start, " +
        "perf_p.period_end, " +
        "perf_metrics.* " +
        "FROM perf_p, perf_metrics " +
        "UNION DISTINCT SELECT " +
        "perf_p.period, " +
        "perf_p.period_mod, " +
        "perf_p.period_start, " +
        "perf_p.period_end, " +
        "perf_metrics_all.* " +
        "FROM perf_p, perf_metrics_all), " +
        "deduct_a_office AS (SELECT " +
        "'A OFFICE' AS office, " +
        "CASE WHEN (date >= begindate AND date <= enddate) THEN CONCAT(begindate_format, ' up to ', enddate_format) ELSE 'not in range' END AS period, " +
        "deduction, " +
        "total " +
        "FROM `plainaccessible.BrokeragePerformance.deductions_A` " + //Do this: 1) Change the project ID to your own Google Cloud project ID. 2) Change the dataset name to your your own dataset name, if it's not "Brokerageperformance".
        "WHERE (date >= begindate AND date <= enddate)), " +
        "deduct_b_office AS (SELECT " +
        "'B OFFICE' AS office, " +
        "CASE WHEN (date >= begindate AND date <= enddate) THEN CONCAT(begindate_format, ' up to ', enddate_format) ELSE 'not in range' END AS period, " +
        "deduction, " +
        "total " +
        "FROM `plainaccessible.BrokeragePerformance.deductions_B` " + //Do this: 1) Change the project ID to your own Google Cloud project ID. 2) Change the dataset name to your your own dataset name, if it's not "Brokerageperformance".
        "WHERE (date >= begindate AND date <= enddate)), " +
        "deduct_c_office AS (SELECT " +
        "'C OFFICE' AS office, " +
        "CASE WHEN (date >= begindate AND date <= enddate) THEN CONCAT(begindate_format, ' up to ', enddate_format) ELSE 'not in range' END AS period, " +
        "deduction, " +
        "total " +
        "FROM `plainaccessible.BrokeragePerformance.deductions_C` " + //Do this: 1) Change the project ID to your own Google Cloud project ID. 2) Change the dataset name to your your own dataset name, if it's not "Brokerageperformance".
        "WHERE (date >= begindate AND date <= enddate)), " +
        "deduct_each_office AS (SELECT " +
        "* FROM deduct_a_office " +
        "UNION ALL SELECT * FROM deduct_b_office " +
        "UNION ALL SELECT * FROM deduct_c_office), " +
        "deduct_all AS (SELECT " +
        "office, " +
        "period, " +
        "SUM(IF(deduction IN UNNEST(rev_share_group), total, 0)) AS rev_share, " +
        "SUM(IF(deduction IN UNNEST(base_split_group), total, 0)) AS base_split, " +
        "SUM(IF(deduction IN UNNEST(transaction_fee_group), total, 0)) AS transaction_fee, " +
        "SUM(IF(deduction IN UNNEST(aegis_atera_group), total, 0)) AS aa_split, " +
        "(SUM(IF(deduction IN UNNEST(base_split_group), total, 0)) + SUM(IF(deduction IN UNNEST(transaction_fee_group), total, 0))) AS total_brokerage_income " +
        "FROM deduct_each_office " +
        "GROUP BY office, period " +
        "UNION ALL SELECT " +
        "'ALL' AS office, " +
        "period, " +
        "SUM(IF(deduction IN UNNEST(rev_share_group), total, 0)) AS rev_share, " +
        "SUM(IF(deduction IN UNNEST(base_split_group), total, 0)) AS base_split, " +
        "SUM(IF(deduction IN UNNEST(transaction_fee_group), total, 0)) AS transaction_fee, " +
        "SUM(IF(deduction IN UNNEST(aegis_atera_group), total, 0)) AS aa_split, " +
        "(SUM(IF(deduction IN UNNEST(base_split_group), total, 0)) + SUM(IF(deduction IN UNNEST(transaction_fee_group), total, 0))) AS total_brokerage_income " +
        "FROM deduct_each_office " +
        "GROUP BY period) " +
        "SELECT perf_all.*, deduct_all.rev_share, deduct_all.base_split, deduct_all.transaction_fee, deduct_all.aa_split, deduct_all.total_brokerage_income " +
        "FROM perf_all " +
        "JOIN deduct_all " +
        "ON perf_all.period = deduct_all.period AND perf_all.office = deduct_all.office " +
        "WHERE perf_all.office = '" + setOffice + "' " +
        "ORDER BY CASE WHEN " +
        "office = 'ALL' THEN 1 WHEN office = 'A OFFICE' THEN 2 WHEN office = 'B OFFICE' THEN 3 WHEN office = 'C OFFICE' THEN 4 ELSE 5 END ASC;",

      useLegacySql: false
    };
    var queryResults = BigQuery.Jobs.query(request, projectId);
    var jobId = queryResults.jobReference.jobId;


    /*******************This section retrieves one row of query results.*/
    var rows = queryResults.rows;
    while (queryResults.pageToken) {
      queryResults = BigQuery.Jobs.getQueryResults(projectId, jobId, {
        pageToken: queryResults.pageToken
      });
      rows = rows.concat(queryResults.rows);
    }

    if (!rows) {
      console.log('No rows returned.');
      return;
    }


    /*******************This section takes the row of query results and inserts
     * the results into one row of the spreadsheet report.*/
    var spreadsheet = SpreadsheetApp.getActiveSpreadsheet();
    var sheet = spreadsheet.getSheetByName(officeInput);

    var columnSet = [];
    var colStartSet = null;

    var rowStart = inputPromptFN('Add results to row:');
    if (rowStart === null || typeof rowStart === 'undefined') {
      console.log('Operation canceled by user.');
      return;};

    if (timeFrame ==='WEEKLY') {
      columnSet = ['period_mod', 'total_volume', 'total_ends', 'list_volume', 'sell_volume', 'list_ends', 'sell_ends', 'list_ratio', 'rev_share', 'base_split', 'transaction_fee', 'aa_split', 'total_brokerage_income'];
      colStartSet = 1;
      appendDataToSheet(rows, columnSet, sheet, rowStart, colStartSet);
    } else {
      columnSet = ['period_mod', 'total_volume', 'total_ends', 'avg_price', 'list_volume', 'sell_volume', 'avg_list_price', 'avg_sell_price', 'list_ends', 'sell_ends', 'list_ratio', 'rev_share', 'base_split', 'transaction_fee', 'aa_split', 'total_brokerage_income'];
      colStartSet = 1;
      appendDataToSheet(rows, columnSet, sheet, rowStart, colStartSet);
    };

    console.log('Results added.');
    SpreadsheetApp.getUi().alert('Results added.');

  } catch (error) {
    console.error('An error occurred:', error);
    SpreadsheetApp.getUi().alert('An error occurred: ' + error);
    return;
  }


  /*******************inputPromptFN() is a nested function within runQuery(). This
   * function creates the message box that will ask you to input date range info and
   * office info for your desired query results.*/
  function inputPromptFN(promptMsg){
    var inputPrompt = SpreadsheetApp.getUi().prompt(promptMsg, SpreadsheetApp.getUi().ButtonSet.OK_CANCEL);
    if (inputPrompt.getSelectedButton() !== SpreadsheetApp.getUi().Button.OK) {
      return null;
    } else{
      return inputPrompt.getResponseText();
    }
  }


  /*******************appendDataToSheet() is a nested function within runQuery(). This
   * function handles the process of inserting query results into the speradsheet report.*/
  function appendDataToSheet(dataSet, columnSet, sheet, rowStart, colStart) {

    var data = new Array(dataSet.length);
    for (var i = 0; i < dataSet.length; i++) {
      var cols = dataSet[i].f;
      data[i] = new Array(columnSet.length);
      for (var j = 0; j < columnSet.length; j++) {
        var columnName = columnSet[j];
        var columnIndexInQueryResults = queryResults.schema.fields.findIndex(function (field) {
          return field.name === columnName;
        });
        if (columnIndexInQueryResults !== -1) {
          data[i][j] = cols[columnIndexInQueryResults].v;
          sheet.getRange(i + rowStart, j + colStart).setValue(cols[columnIndexInQueryResults].v);
        }
      }
    }
    sheet.getRange(rowStart, colStart, dataSet.length, columnSet.length).setValues(data);
  }
}//End of the runQuery() function.


/**The mergeToReport() function takes report data from the spreadsheet
 * report and inserts it into a Google Doc that can be used to create a readable report.
 * The function was named "mergeToReport" because it reminds me of the mail merge feature
 * for Microsoft Office apps.*/
function mergeToReport() {
  try {
    var sheetInput = inputPromptFN('1 - Sheet Name', 'Enter the sheet/tab name (case-sensitive):');
    if (sheetInput === null || typeof sheetInput === 'undefined') {
      console.log('Operation canceled by user.');
      return;
    };

    var activeSheet = SpreadsheetApp.getActiveSpreadsheet().getSheetByName(sheetInput);
    if (!activeSheet) {
      try{
        throw new Error('Sheet \"' + sheetInput + '\" not found.');
      } catch (error) {
        console.error(error.message);
        SpreadsheetApp.getUi().alert(error.message);
        return;
      };
    }

    var periodInput = inputPromptFN('2 - Performance Period', 'Enter the performance period:');
    if (periodInput === null || typeof periodInput === 'undefined') {
      console.log('Operation canceled by user.');
      return;
    };

    var findPeriodColumn = activeSheet.getRange('A:A').getValues().flat();
    var startRow = findPeriodColumn.findIndex(function(period) {
      return period === periodInput;
    });
    if (startRow === -1) {
      try{
        throw new Error ('\"' + periodInput + '\" not found.');
      } catch (error) {
        console.error(error.message);
        SpreadsheetApp.getUi().alert(error.message);
        return;
      };
    }

    /*******************Do this: Replace "____" with the file ID of your own Readable Report
     * Template Google Doc. The file ID is found in the URL bar where you view your Google Doc.
     * It's the string of text between "spreadsheets/d/" and the next forward slash ("/")
     * character. E.g., I'm using "1TwUx-Y3COrSVZowgmhTfuaaEpBpXfFpczi7JCth9YCg" as my file ID,
     * but your own file ID will be different. Use the file ID of the Google Doc copy
     * you created earlier.*/
    var copyFile = DriveApp.getFileById('____').makeCopy();
    var copyId = copyFile.getId();
    var copyDoc = DocumentApp.openById(copyId);
    var copyBody = copyDoc.getBody();

    var numOfCol = activeSheet.getLastColumn();
    var activeRow = activeSheet.getRange(startRow + 1, 1, 1, numOfCol).getValues()[0];
    var headerRow = activeSheet.getRange(1, 1, 1, numOfCol).getValues()[0];

    for (var columnIndex = 0; columnIndex < headerRow.length; columnIndex++) {
      var placeholder = '%' + headerRow[columnIndex] + '%';
      copyBody.replaceText(placeholder, activeRow[columnIndex]);
    }

    var keyStrings = ['Total Number of Transactions:', 'Total Volume:', 'Total Brokerage Income:', 'Total Revenue Share Paid Out:', 'List End Ratio =', 'Aegis/ATERA Income:'];

    var paragraphs = copyBody.getParagraphs();
    if (paragraphs.length === 0) {
      try{
        throw new Error ('No paragraphs found in the document.');
      } catch (error) {
        console.error(error.message);
        SpreadsheetApp.getUi().alert(error.message);
        return;
      };
    }

    /*******************Nested loops (loops within loops), each starting with "for".
     * A loop takes a set of objects and performs specific operations on each object,
     * repeating the operations until all objects have been processed or until the loop
     * is forced to stop. These loops examine the lines of each paragraph to look
     * for data that needs to be reformatted. 1) Top-level loop: Looks at each paragraph
     * in the document and breaks each paragraph into smaller elements. Smaller elements
     * are substrings set apart by the "♠" character. 2) Second level loop: Looks at each
     * substring element within a paragraph. 3) Third level loop: For each substring element,
     * checks a set of keywords (keyStrings) to see if any of them can be found within the
     * substring. For any keyword found, the string of text following it contains data from
     * your query results. Finds the data from the query results and formats the data
     * appropriately (money is formatted as $X.XX, percentages are formatted as X%, etc.).*/
    for (var i = 0; i < paragraphs.length; i++) {
      var paragraph = paragraphs[i];
      var paragraphText = paragraph.getText();
      var elements = paragraphText.split('♠');
      for (var j = 0; j < elements.length; j++) {
        var element = elements[j];
        for (var searchString of keyStrings) {
          if (element.indexOf(searchString) !== -1) {
            var startIndex = element.indexOf(searchString);
            var endIndex = startIndex + searchString.length;
            var keyString = element.substring(startIndex, endIndex);
            var selectTextElem = paragraph.findText(keyString);
            if (selectTextElem) {
              var regExp1 = new RegExp('^.*' + keyString + '(.*)');
              var dataString = (regExp1.exec(element))[1].trim();
              var targetTextElem = paragraph.findText(dataString, paragraph.findText(keyString));
              var targetStartOffset = targetTextElem.getStartOffset();
              var targetEndOffset = targetTextElem.getEndOffsetInclusive();
              var newdataString = formatDataString(keyString, dataString);
              paragraph.editAsText().deleteText(targetStartOffset, targetEndOffset);
              paragraph.editAsText().insertText(targetStartOffset, newdataString);
            }
            break;
          }
        }
      }
    }

    /*******************This section removes "♠" throughout the document when it's no longer needed.*/
    var foundText = copyBody.findText('♠');
    while (foundText) {
      var element2 = foundText.getElement();
      if (element2) {
        element2.asText().replaceText('♠', '');
        foundText = copyBody.findText('♠');
      }
    }

    copyDoc.saveAndClose();
    copyDoc.setName('New Output ' + sheetInput + ' ' + periodInput);

  } catch (error) {
    console.error('An error occurred:', error);
    SpreadsheetApp.getUi().alert('An error occurred: ' + error);
    return;
  }


  /*******************inputPromptFN() is a nested function within mergeToReport(). This
   * function creates the message box that will ask you to input date range info and
   * office info for your desired query results.*/
  function inputPromptFN(promptMsg1, promptMsg2){
    var inputPrompt = SpreadsheetApp.getUi().prompt(promptMsg1, promptMsg2, SpreadsheetApp.getUi().ButtonSet.OK_CANCEL);
    if (inputPrompt.getSelectedButton() !== SpreadsheetApp.getUi().Button.OK) {
      return null;
    } else{
      return inputPrompt.getResponseText();
    }
  }


  /*******************formatDataString() is a nested function within mergeToReport(). This
   * function handles the process of formatting your report data.*/
  function formatDataString(keyString, dataString) {
    if (keyString === 'Total Volume:' || keyString === 'Total Brokerage Income:' || keyString === 'Total Revenue Share Paid Out:' || keyString === 'Aegis/ATERA Income:') {
      // Format as currency
      var floatValue = parseFloat(dataString);
      return isNaN(floatValue) ? dataString : floatValue.toLocaleString(undefined, { style: 'currency', currency: 'USD', minimumFractionDigits: 2, maximumFractionDigits: 2 });
    } else if (keyString === 'List End Ratio =') {
      // Format as a percentage rounded to the nearest percent
      var floatValue = parseFloat(dataString);
      return isNaN(floatValue) ? dataString : Math.round(floatValue * 100) + '%';
    } else {
      // No specific formatting for other key strings
      return dataString;
    }
  }
}//End of the mergeToReport() function.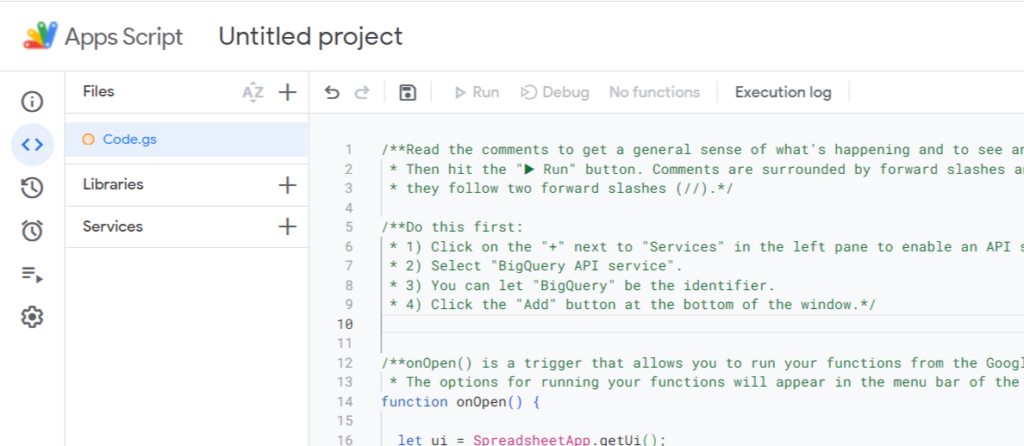
Note the difference between the syntax, or the format, for comments in Apps Script and the syntax for comments in SQL. Read and follow the directions in the Apps Script comments. Your SQL script from BigQuery is written into your Apps Script, so be sure to update the project ID and dataset name wherever they appear again. Also go to Line 343 and ensure that the right file ID is entered between quotation marks. To get the file ID, open your copy of the Google Doc template for the readable report. Find the file ID in the browser address bar similarly to how you found the URIs for your BigQuery tables. The file ID is the string of text between https://docs.google.com/document/d/ and the end URL parameter (/edit#…) mentioned earlier.

For Apps Script to access your query, you’ll also need to enable the BigQuery API service. In the left pane of the screen, click the plus symbol at the end of the Services option.
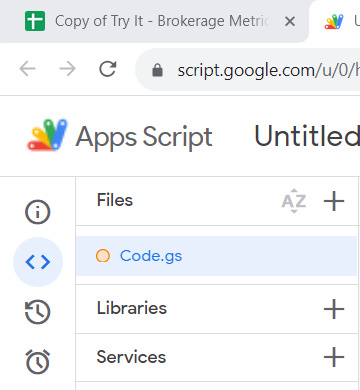
To select the BigQuery API service, click it once. You can let the identifier be “BigQuery.”
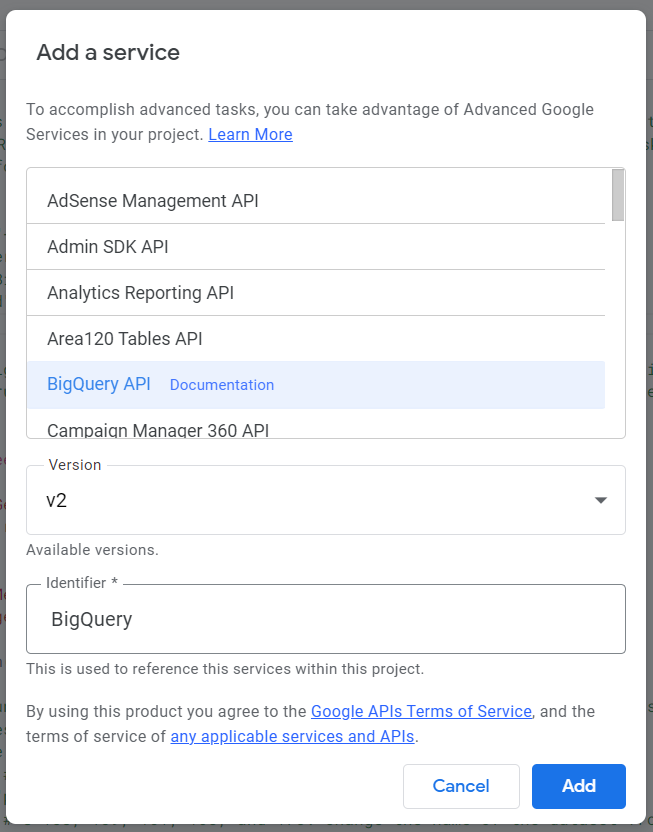
When your script is ready, hit Run in the top menu bar of the Apps Script editor. After the script execution is completed, feel free to close the Apps Script editor and view the normal interface for the brokerage metrics spreadsheet. Refresh the spreadsheet page.
Insert query results – Step 8 (running the Get Query Results function)
You should now see these new options in the Google Sheet menu bar: Get Query Results and Merge to Report.

The new options are functions that perform actions on your spreadsheet. Notice that the spreadsheet has different tabs for the different brokerage offices. Also, there are tabs for weekly data and monthly data

You can stay on the “ALL WEEKLY” tab, or you can navigate to the tab of your choice if you’re interested in data for a specific office/time frame. When you’re looking at your desired tab, click Get Query Results > Get results to run the first function.
When you run a Google Apps Script for the first time, you’ll be prompted to grant the script access to your Google account info. In the prompt, Google will warn you against authorizing apps created by unverified developers. Since the developer in this case is you, go ahead and authorize access. You might have to click the Advanced link near the bottom of the prompt before you can see authorization options.
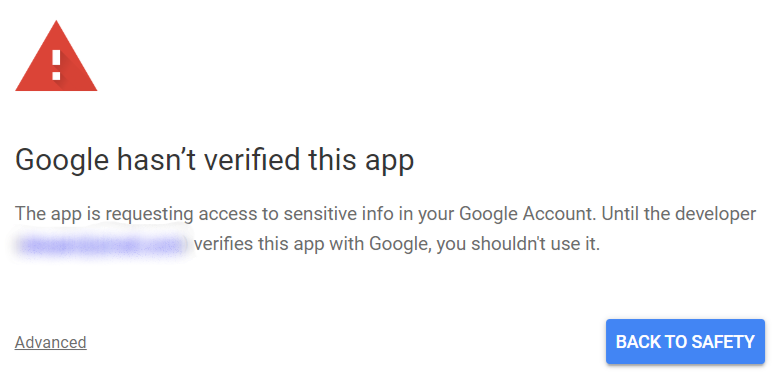
On some occasions, Google users who create Apps Scripts might get a “This app is blocked” message instead of an authorization prompt, and you won’t see any option to grant authorization. If you encounter that message, follow these steps (permanent link) so you can authorize access.
When the function begins execution, it will prompt you to provide different bits of information before it can run your query. The first prompt asks you to decide on the office and the time frame that you want to get query results for. Notice that, instead of directly editing the script to change the date range variables for your query, you now enter those variables when prompted. At some point in the execution, the function will actually run your query via BigQuery. It might take about ten or so seconds to run the query, so don’t be concerned if the execution seems to briefly stall.
Run the function repeatedly to get all of the necessary query results. If you’re getting weekly data, fill rows 2 through 7 with query results for each week. Your brokerage now has a spreadsheet report with weekly or monthly data for the whole brokerage or for one of the offices.
If you first ran the function to get weekly numbers, you should now navigate to the monthly tab for the same office and get monthly numbers. If you got monthly numbers first, navigate to the weekly tab and get weekly numbers.
Insert query results – Step 9 (running the Merge to Report function)
Now run the other function to generate a Google Doc that displays the numbers from the spreadsheet report. Go to the menu bar and click Merge to Report > Merge. This function will look at your Google Doc template for the readable report and create a new document with a paragraph of text formatted similarly to what’s in the template. Numbers from one week or one month of the spreadsheet report will be retrieved and added to the new document.
To view your new document, go to your Google Drive and navigate to the location of your template document. The new document will be in the same location as the template document. Notice that the numbers in the new document (e.g., currency and percentages) are already formatted appropriately. You can run the Merge to Report function until you have all of the paragraphs you need to create a readable report.
If you don’t like any bit of what you just saw
If you feel like the walls of script shown above have now completely put you off from learning any scripting or other coding languages, that’s a fair reaction. For now, do the exercise as a passive observer. You’re checking out a demo and not undertaking a scripting lesson here, so there’s very little commitment. I just want you to see what’s possible with these things you can access for free.
Do pay attention to the comments placed throughout the scripts to get a general sense of what’s happening. Note that these particular reports require these scripts, but data analysis tools don’t always have to look like these to be useful. In upcoming posts, I’ll drip-feed you a few other, much simpler examples of what you can do with SQL, Google Apps Script, and some other tools.
Also keep in mind that some of the more time-consuming steps in the exercise above are related to one-time setup, and using scripting environments gets easier the more you use them. As an employee at PLAIN Realty, you would save the scripts you’ve written and reuse them as needed. So report-building for the next month would be easier than it is for the current month.
Finally, it’s ok if you can’t look at the brokerage report exercise and see a solution to your own problem right away. Remember to make note of whatever solutions you’d like to see for your work or some other aspect of your life, and keep those notes for pseudocode. Do you work with large contact lists that you’re responsible for maintaining? Do you create itineraries for someone who travels frequently or attends many events in a year? You might pick up something useful from the next examples.
If you’re inspired
If the script above leaves you fascinated instead of repulsed, and you’re already interested in learning more about coding, consider learning Python and SQL first. Python is one of the programming languages best suited for data analysis, and it can interact with a wide range of different computer programs.
If you’re actually an experienced programmer, don’t spare my feelings. Let me know if you see areas where the script shown above can be improved, or share any other thoughts.
